After loading the map, you will find the menu toolbar on the left-hand side of the screen on a navy-blue vertical strip.
1.
The Home icon ![]() will take you back to the main page where you can
read about the map and the importance of monitoring and managing
groundwater.
will take you back to the main page where you can
read about the map and the importance of monitoring and managing
groundwater.
2. This icon ![]() will divert you to the “deep dive” map with more
details and navigation options if you want to explore the map
even more. This is suitable for environmental scientists and
practitioners in the field.
will divert you to the “deep dive” map with more
details and navigation options if you want to explore the map
even more. This is suitable for environmental scientists and
practitioners in the field.
 3. Click on the Add/remove
map layers icon
3. Click on the Add/remove
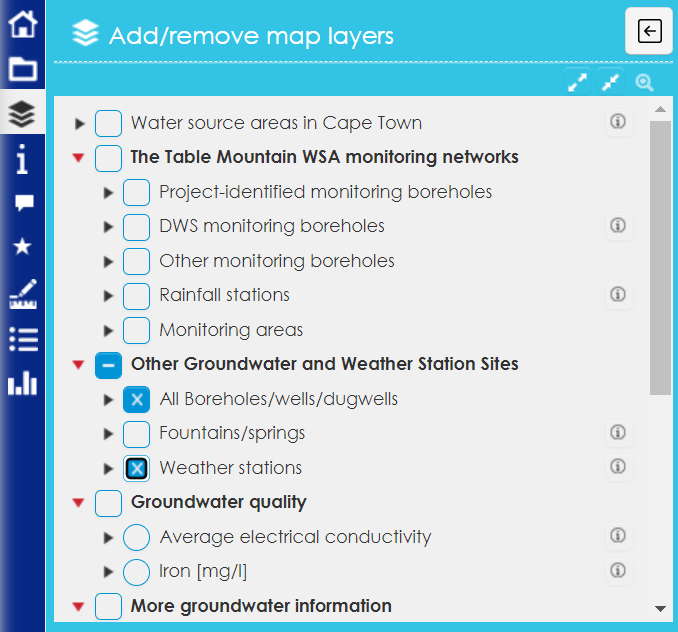
map layers icon ![]() on the blue strip to reveal the layers of the map.
Then click the check-boxes
on the blue strip to reveal the layers of the map.
Then click the check-boxes ![]() to select what you wish to see displayed on the
map on your right. E.g., boreholes/ wells/ dug wells, and
weather stations as shown on the screen shot on the right.
Checking and unchecking the check-boxes will switch the layers
displayed on the map on and off. Click on this icon:
to select what you wish to see displayed on the
map on your right. E.g., boreholes/ wells/ dug wells, and
weather stations as shown on the screen shot on the right.
Checking and unchecking the check-boxes will switch the layers
displayed on the map on and off. Click on this icon: ![]() next to a layer for more information on it. E.g.,
Water source areas in Cape Town. If you need more information on
how the layer is displaying the features in different colours
you can click the ▶ icon to expand a legend. Clicking on the
layer name itself will open an information popup about what the
layer displays and possibly links to other documents.
next to a layer for more information on it. E.g.,
Water source areas in Cape Town. If you need more information on
how the layer is displaying the features in different colours
you can click the ▶ icon to expand a legend. Clicking on the
layer name itself will open an information popup about what the
layer displays and possibly links to other documents.
4. Select the Map
overview icon ![]() for more information on the map, which also has a
link to this page.
for more information on the map, which also has a
link to this page.
5. Most active layers
allow you to click on the displayed map features to obtain
information about the feature. E.g., clicking on a borehole pops
up a panel with information like borehole identifiers,
coordinates, use, etc. If other data like water levels over time
are available for that borehole or rainfall over time for a
rainfall station, a chart will also be displayed. The
information popup (and other information panels) will replace
the Add/remove
map layers panel, which can then be re-opened by clicking
the ![]() icon.
icon.
7. Select the View/hide
data tables icon ![]() to view detailed data on boreholes, springs and
rainfall stations
to view detailed data on boreholes, springs and
rainfall stations
8. Select the Statistics
icon ![]() to view average groundwater levels in your area
and in other locations you might be interested in. The
statistics will be displayed on the right side of the map.
Please make sure to read the help on the statistics for
clarification of the displayed information and charts.
to view average groundwater levels in your area
and in other locations you might be interested in. The
statistics will be displayed on the right side of the map.
Please make sure to read the help on the statistics for
clarification of the displayed information and charts.
9. Use the search function ![]() at the top right to search for a specific
location.
at the top right to search for a specific
location.
10. Map icons on the brown navigation bar on the top
right-hand side of the map will help you pan and zoom in and out
of the map.
💡 TIP: If you need to get back to this page
at any point of your map navigation, you can go to the home
page and find the “How to navigate” link towards the bottom.
Copyright ©