
 The maps used on this
website have several components for navigation, searching and
display. Here is a short description of each component to make
using the map easier. Please also make sure you have read the
disclaimer, which you can find on the introductory (Home) page
and here.
The maps used on this
website have several components for navigation, searching and
display. Here is a short description of each component to make
using the map easier. Please also make sure you have read the
disclaimer, which you can find on the introductory (Home) page
and here.
The map components are the Main Toolbar, the Navigation Bar, the “Locating” Tool, the Overview panel and an Information/Statistics and Chart display panel on the right or bottom of the page (if you need help and more information about the Statistics Panel now you can click here. There are, however, additional panels, like the Data, Selection and other panels, that can be activated by using functions in the other toolbars/panels.
A Search input in the map header allows searching for places on the earth using the Nominatim open-source geocoding database. Even if places are found through the search the map may not necessarily zoom to them as they might be outside the defined map extent of the project.
The Main Toolbar:
This vertical toolbar is generally displayed on the left side of the screen and has several buttons, which mostly switch other components or panels on or off.
 Just
below the Home button, which takes the user to the
introductory Home page, is a folder button which can take the
user to the "Quick View" dashboard. Under the folder button is
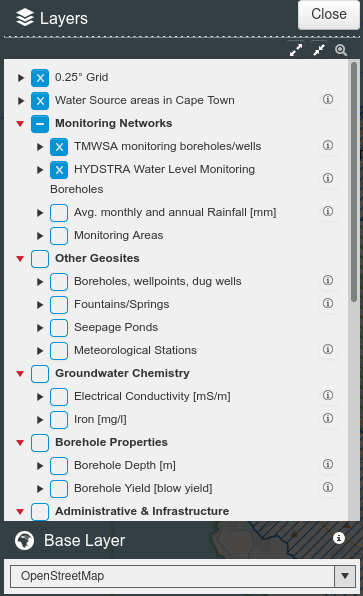
the Add/remove map layers button. Clicking this button
brings up a panel (see figure on the left) with all available
layers that the user can select to be shown or hidden (by
checking the relevant check boxes). Some layers may be greyed,
meaning that they may only show at certain zoom levels
(generally zoom in to make these available). Clicking on the
check boxes of the groups will switch the whole group of layers
on or off.
Just
below the Home button, which takes the user to the
introductory Home page, is a folder button which can take the
user to the "Quick View" dashboard. Under the folder button is
the Add/remove map layers button. Clicking this button
brings up a panel (see figure on the left) with all available
layers that the user can select to be shown or hidden (by
checking the relevant check boxes). Some layers may be greyed,
meaning that they may only show at certain zoom levels
(generally zoom in to make these available). Clicking on the
check boxes of the groups will switch the whole group of layers
on or off.
Clicking the triangle bullets to the left of the check boxes will open the legend for the layer. These legends may sometimes only be one line or point or polygon, which represents that layer on the map. But they may also show graduated or categorised symbologies in different colours or sizes representing properties of the elements of the relevant layer; e.g. points in different colours may represent different water quality or polygons in different colours may represent different geology or groundwater abstraction potential.
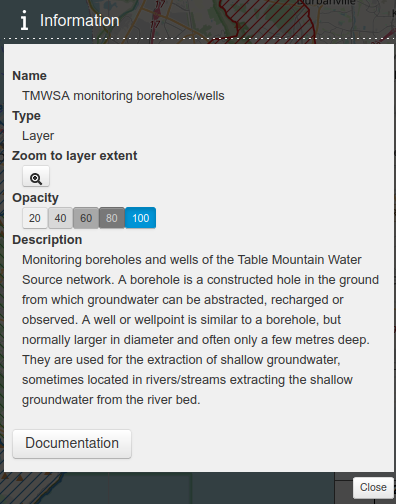 Clicking
on the layer name itself will bring up an Information panel (see
figure on the right) with a description on what the layer shows,
but also a Documentation button at the bottom that may take the
user to an external link or document where more information
about the item that the layer shows can be found. This button
function is the same as clicking the little (i) on the right
hand side of the layer name.
Clicking
on the layer name itself will bring up an Information panel (see
figure on the right) with a description on what the layer shows,
but also a Documentation button at the bottom that may take the
user to an external link or document where more information
about the item that the layer shows can be found. This button
function is the same as clicking the little (i) on the right
hand side of the layer name.
The opacity of the layer can also be set so that one can “see through” the layer into the layers underneath. This may sometimes be helpful with coloured polygon layers like lithology or harvest potential, e.g. at a 60% opacity, and still see the underlying base maps. Clicking the “Zoom to layer extent” button will zoom to show the complete layer within the maximum extent of the map project.
At the bottom of the Layers panel is the Base Layer drop-down, where several different background maps may be selected. All of these are Internet based and may display or not, depending on whether the server hosting them is available. Some of these load only when completely retrieved from the server hosting them, others build up tile by tile as they are downloaded. Please note that these base layers are created by third parties and are generally available to the public over the Internet. We do not, however, have any influence on their quality and/or correctness. They may have license restrictions, which we are adhering to by referencing them in the “Attributions” displayed at the bottom of the map window, and which you may access by using the relevant URLs. Some of the base layers can also not be printed as backgrounds.
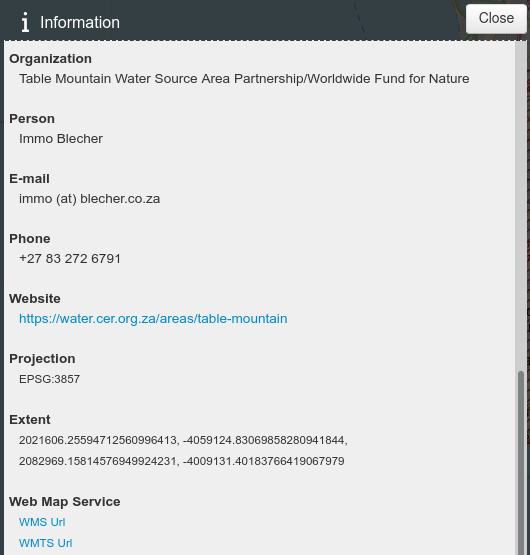 The
Map overview button below the Layers button on the
toolbar brings up another Information panel (see figure on the
left) with not only a general description of the map, but also a
description and meta-data on the project and map itself. This
includes the organisation, contact details (to obtain more
information or ask questions), the projection and Web Map
Service links, which can be used to open the project and map
inside desktop or other online GIS applications.
The
Map overview button below the Layers button on the
toolbar brings up another Information panel (see figure on the
left) with not only a general description of the map, but also a
description and meta-data on the project and map itself. This
includes the organisation, contact details (to obtain more
information or ask questions), the projection and Web Map
Service links, which can be used to open the project and map
inside desktop or other online GIS applications.
The Popup button is one of the most important buttons to obtain (or hide) information on any element on the map by clicking on it. Some elements may not pop up any information as these may only be simple lines, like the grid, or are composed of only a few polygons, which are mostly explained in the legend, or they do not need to be explained in any way. Generally the Pop-up panel comes up by just clicking on any element in the map, but can then be switched off with the Popup or the Close button on the panel. Clicking on any area of the base map without any other layer information above will only return a short pop-up with no information.
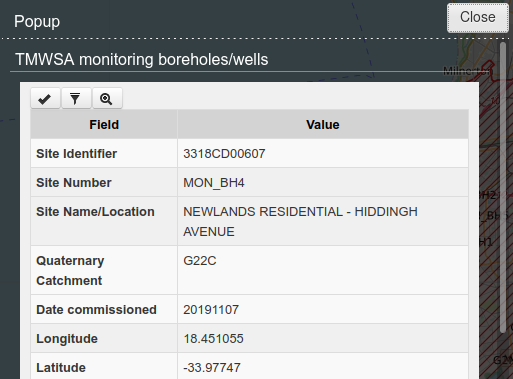 Pop-up
information (see figure on the right) generally includes element
descriptions (names, numbers, location, use, meaning, etc.),
which are stored in the database behind the map, but may also
include charts under the description showing e.g. time-dependent
information like water levels or water quality over time. These
charts can be downloaded as PNGs, or one can zoom into or out of
specific time periods of the chart. Please note that the
database may have many more fields with data stored in them than
those displayed here, most of which go beyond the scope of these
maps and would make no difference to the user experience.
Pop-up
information (see figure on the right) generally includes element
descriptions (names, numbers, location, use, meaning, etc.),
which are stored in the database behind the map, but may also
include charts under the description showing e.g. time-dependent
information like water levels or water quality over time. These
charts can be downloaded as PNGs, or one can zoom into or out of
specific time periods of the chart. Please note that the
database may have many more fields with data stored in them than
those displayed here, most of which go beyond the scope of these
maps and would make no difference to the user experience.
The three buttons at the top of the Popup panel allow “Select” and “Filter” for use in other sections of the map and “Zoom” to zoom into that specific point or line or polygon on the map.
The Selection button (star) brings up a Selection panel inside the map with various options to select from selectable layers. Not all layers are selectable, but those that are, allow the download of the relevant and published layer information in various formats.
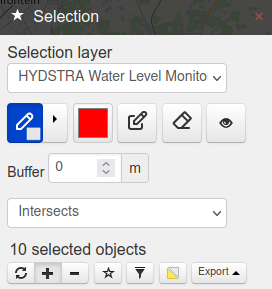 With
the selection temporary features are created which can be
rectangles, circles or simple point selections etc., which are
used to mark selections from layers. These may then be exported
from the selection panel or from the Data tool described further
down. The temporary features can then be removed by using the
Eraser button (“Delete all features”) or switched on/off with
the Display/Hide button. If the selection features are not
removed during one session they may pop up again in a new
session (selection features are remembered between sessions!).
With
the selection temporary features are created which can be
rectangles, circles or simple point selections etc., which are
used to mark selections from layers. These may then be exported
from the selection panel or from the Data tool described further
down. The temporary features can then be removed by using the
Eraser button (“Delete all features”) or switched on/off with
the Display/Hide button. If the selection features are not
removed during one session they may pop up again in a new
session (selection features are remembered between sessions!).
Depending on the selected button at the bottom of the panel, selections may be added or removed or the selection inverted or a new one started.
On some maps the next button under the Selection button is the Locating button, which brings up a panel with one or more drop-downs, which allow typing, e.g. geosite numbers, to search for their location on the map. Generally the typing of two to three characters brings up a drop-down to select any matching number to locate. These Locating drop-downs may also be integrated into the Information/Statistics/Charts panel, where they allow certain specific search and display functions.
Below the Selection (or Locating) button is the Geolocation button, which allows the map to access the current location of the user. This is practical for tablets or mobile phones in the field to go directly to a geosite as the current location is updated by the device’s GPS. The Start button makes the geolocation active with the coordinates and accuracy displayed in a small panel with a few self-explanatory settings.
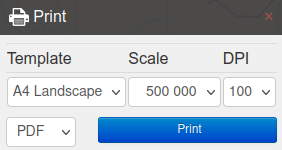 The
Print button allows printing the map to PDF and some
other graphics formats. On a small panel (see figure on the
right) one can select a Template, Scale and DPI (resolution) for
the map output. The scale determines the size of the map within
the template setting, e.g. the bigger the scale the smaller the
rectangle for the map that will fit into the template. There may
only be one template (e.g. A4 Landscape) or several templates
defined for the map, including portrait layouts.
The
Print button allows printing the map to PDF and some
other graphics formats. On a small panel (see figure on the
right) one can select a Template, Scale and DPI (resolution) for
the map output. The scale determines the size of the map within
the template setting, e.g. the bigger the scale the smaller the
rectangle for the map that will fit into the template. There may
only be one template (e.g. A4 Landscape) or several templates
defined for the map, including portrait layouts.
The Measure button brings up a small panel which allows
measuring Length (line, distance), Perimeter, Area and Angle in
km/km2/° respectively.
The Permalink button shows a panel that allows copying and
sharing the current map layout with other users or embedding the
map into an “iframe” of another website. Additionally bookmarks
for the current view can be set. These can then be used to
switch between different views/versions of the map.
The Draw button under the Permalink button can be used to draw different shapes on the map, e.g. to highlight areas before printing. These shapes can be exported in various formats for use in other applications. Shapes/layers can also be imported in various formats as overlays onto the map.
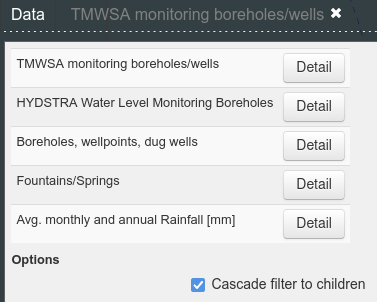
 Clicking
the View/hide
data tables button shows a panel with layers that are available
for data viewing and export. Under the options may be a check-box “”, which,
when checked, allows the filtering of the viewed data of related
child records in a one-to-many relationship. Clicking any Detail
button shows that layers tabular data with all the published
fields (the table may have many more fields which may not be
relevant to this web map). Underneath the table may be one or
more related child tables, which only show the children, once a
record in the parent table is clicked or selected. The button to
the left of the records are self-explanatory.
Clicking
the View/hide
data tables button shows a panel with layers that are available
for data viewing and export. Under the options may be a check-box “”, which,
when checked, allows the filtering of the viewed data of related
child records in a one-to-many relationship. Clicking any Detail
button shows that layers tabular data with all the published
fields (the table may have many more fields which may not be
relevant to this web map). Underneath the table may be one or
more related child tables, which only show the children, once a
record in the parent table is clicked or selected. The button to
the left of the records are self-explanatory.
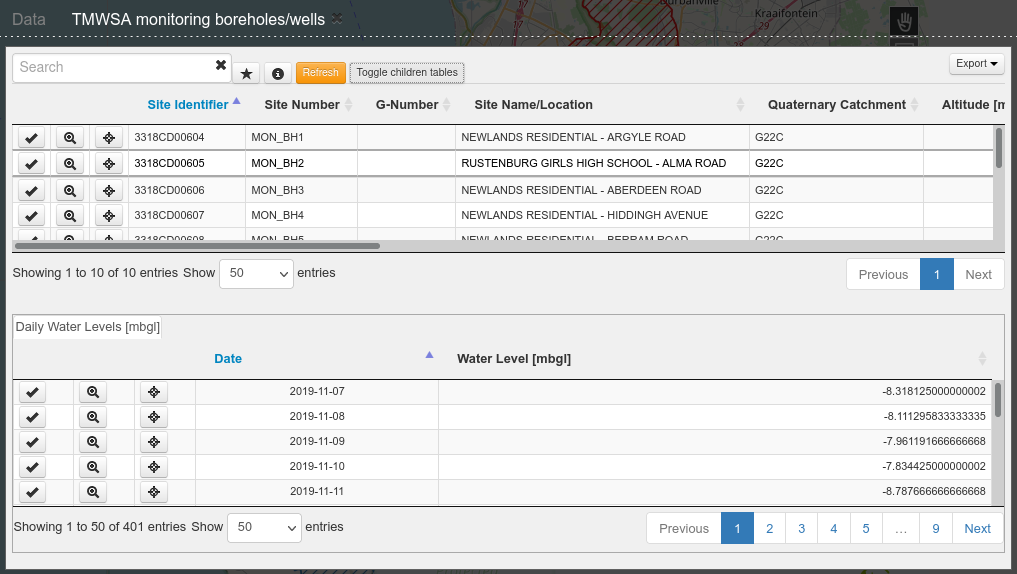
The Export button on the top right of the Data panel allows the export of data in various formats. The GeoJSON format is a GIS format which should be accessible/readable from most modern GIS applications.
Clicking one or more Detail buttons in the data panel will open the relevant layers in tabs, which are accessible by clicking on the tab itself. These remain open during the session unless closed explicitly.
Under the View/hide data tables button is the Statistics button, which switches the
Statistics panel on the right hand side on/off. Click on the button below
to get more information about the statistics panel.
Map icons on the navigation bar on the top right-hand side of the map will help you pan and zoom in and out of the map.
Copyright ©